Seattle Real Estate – 2020 in Review
Real Estate in 2020 was Extremely Strong
2020 was an interesting year for real estate. Despite everything going on, the real estate market has been very strong throughout the year. In 2020, the number of sales and the average sales price increased from the prior year. All 25 counties in the NWMLS saw an increase in average home price with an increase of 11% and an 8% increase for condos. Several counties experienced price growth that exceeded 20%. For example, Kittitas County, which begins at Snoqualmie Pass and ends at the Columbia River, saw average home sales price increase from $445,917 to $550,028. In King County, home prices increased nearly 8% while condo prices were up 10%.
The early indications are the market will continue to be strong in 2021. For example, real estate inventory in the 25 counties was a mere 4,732 heading into 2021. In contrast, going into 2020 there were 8,469 listings. Thus, inventory is down 44%.
Seattle Real Estate Report
Seattle real estate saw gains in both homes and condos, although the gain was not as impressive as other counties or even King County. The average price of Seattle homes increased 5.7% in 2020 while Seattle condo prices increased 2%. In addition, the number of sales increased over 12%. Over 8,395 Seattle homes were sold compared to 7,485 in the previous year. The number of condo sales was up slightly as well (2,375 in 2020 vs 2,359 in 2019).
Seattle Single Family Homes
| # of Sales | Avg Sales Price ($) | |||
| Neighborhoods | 2020 | 2019 | 2020 | 2019 |
| West Seattle | 1,744 | 1,645 | $ 751,295 | $ 706,352 |
| Mt Baker To Rainier Beach | 702 | 607 | $ 775,287 | $ 774,319 |
| SODO to Columbia City | 486 | 433 | $ 666,324 | $ 623,080 |
| Montlake to Leschi | 1,027 | 868 | $ 1,223,067 | $ 1,196,203 |
| Queen Anne to Magnolia | 800 | 693 | $ 1,240,374 | $ 1,206,258 |
| Ballard to Haller Lake | 2,369 | 2,129 | $ 893,989 | $ 839,257 |
| Laurelhurst to Northgate | 1,267 | 1,110 | $ 1,016,296 | $ 940,446 |
| Totals | 8,395 | 7,485 | $ 932,965 | $ 882,654 |
Seattle Condos
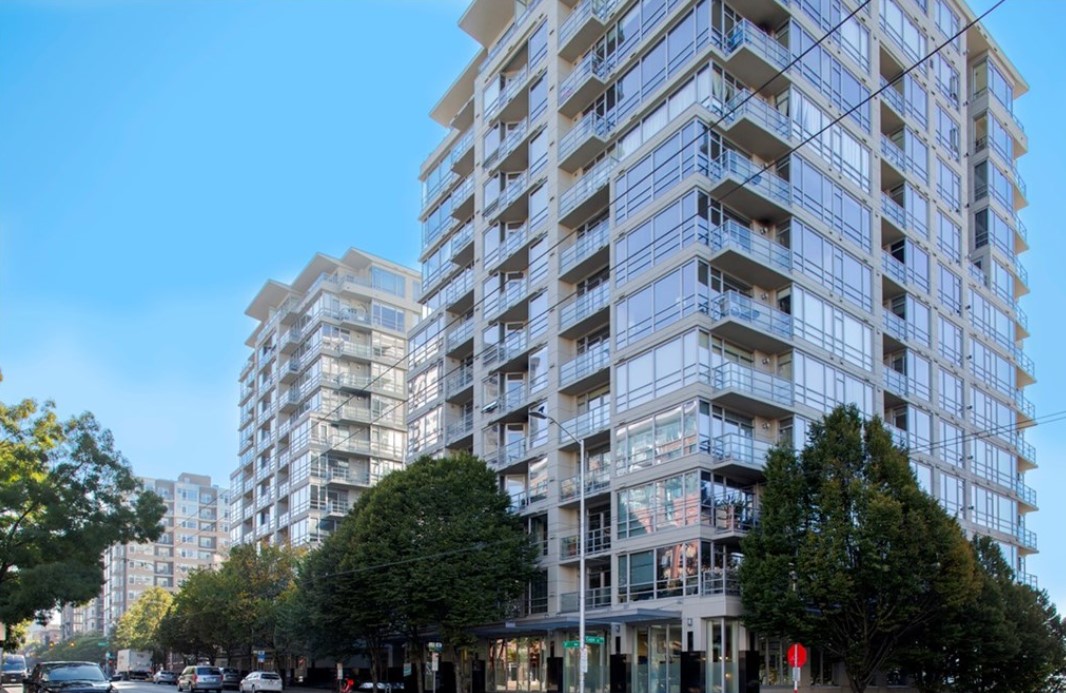
The Concord, Belltown Condo near Sculpture Park – Unit Available for Purchase
| # of Sales | Avg Sales Price ($) | |||
| Neighborhoods | 2020 | 2019 | 2020 | 2019 |
| West Seattle | 201 | 235 | $ 512,371 | $ 492,017 |
| Mt Baker To Rainier Beach | 29 | 27 | $ 381,429 | $ 373,034 |
| SODO to Columbia City | 45 | 33 | $ 476,024 | $ 452,238 |
| Montlake to Leschi | 570 | 577 | $ 583,262 | $ 535,780 |
| Belltown | 409 | 426 | $ 598,978 | $ 581,264 |
| Queen Anne to Magnolia | 444 | 474 | $ 828,902 | $ 849,399 |
| Ballard to Haller Lake | 472 | 377 | $ 461,538 | $ 439,234 |
| Laurelhurst to Northgate | 205 | 210 | $ 426,406 | $ 398,025 |
| Totals | 2,375 | 2,359 | $ 583,664 | $ 571,927 |
Seattle Real Estate Questions? Contact Us!
To learn more about the Greater Seattle real estate market, feel free to reach out to Ewing and Clark. Likewise, you can contact our Seattle real estate agents. We have been providing the Seattle region real estate service since 1900. In addition, for more information on other local areas, look for our market reports on our real estate blog.
Sorry we are experiencing system issues. Please try again.